Infomages: Embedding Data into Thematic Images
Description:
Recent studies have indicated that visually embellished charts such as infographics have the ability to engage viewers and positively affect memorability.
Fueled by these findings, researchers have proposed a variety of infographic design tools.
However, these tools do not cover the entire design space.
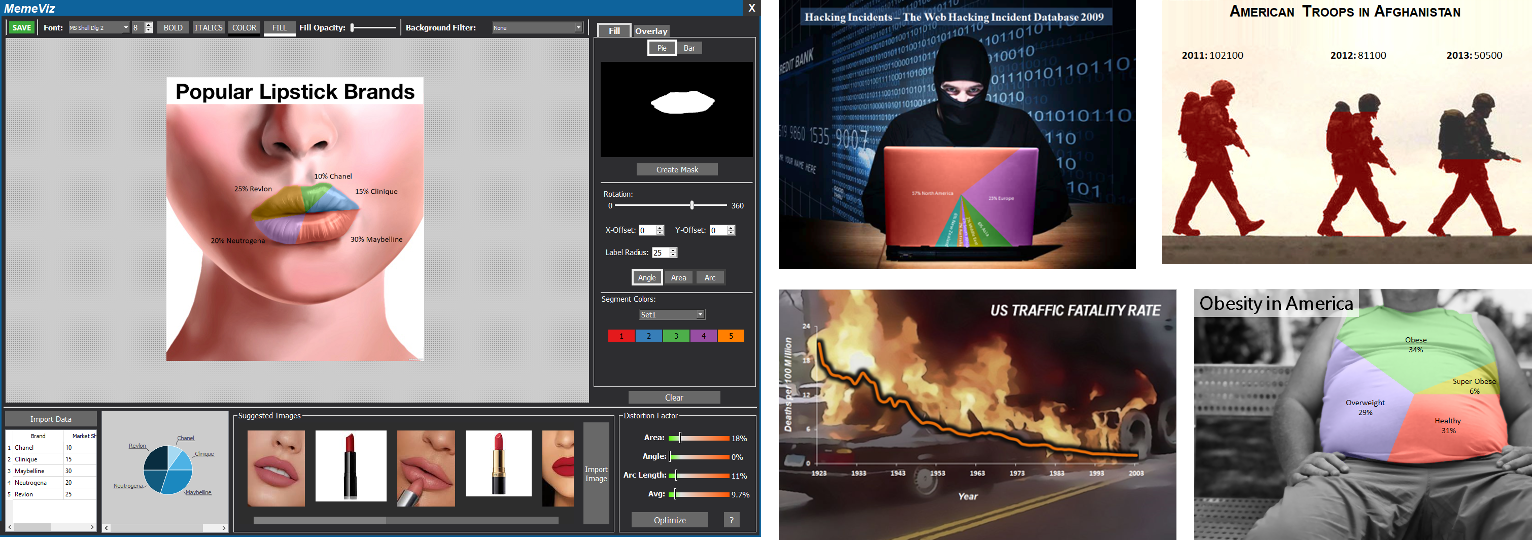
For this project, we focus on a subset of infographics that we call infomages.
Infomages are casual visuals of data in which a data chart is embedded into a thematic image such that the content of the image reflects the subject and the designer's interpretation of the data.
Creating an effective infomage, however, can require a fair amount of design expertise and is thus out of reach for most people.
This project aims to afford non-artists with the means to design convincing infomages.
We first study the principled design of existing infomages and identify a set of key chart embedding techniques.
Informed by these findings we build a design tool that links web-scale image search with a set of interactive image processing tools to empower novice users with the ability to design a wide variety of infomages.
As the embedding process might introduce some amount of visual distortion of the data our tool employs methods to aid users gauge the amount of this distortion, if any.
Best Paper Runner-Up Award at Eurovis 2020
PDF | SUPP | VIDEO | PPT | DATASET | CODE